Maps and Statistics
Learn more about the statistics from Community Board 8 Area
Assembly District
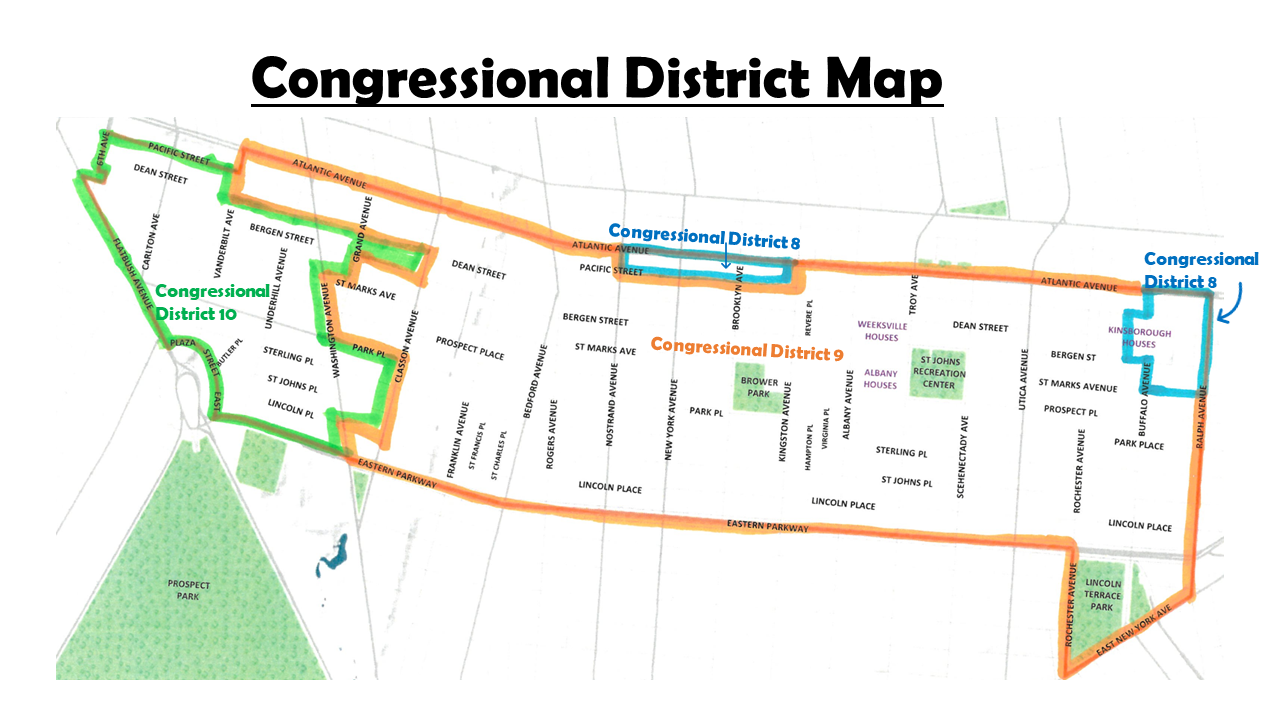
Congressional District
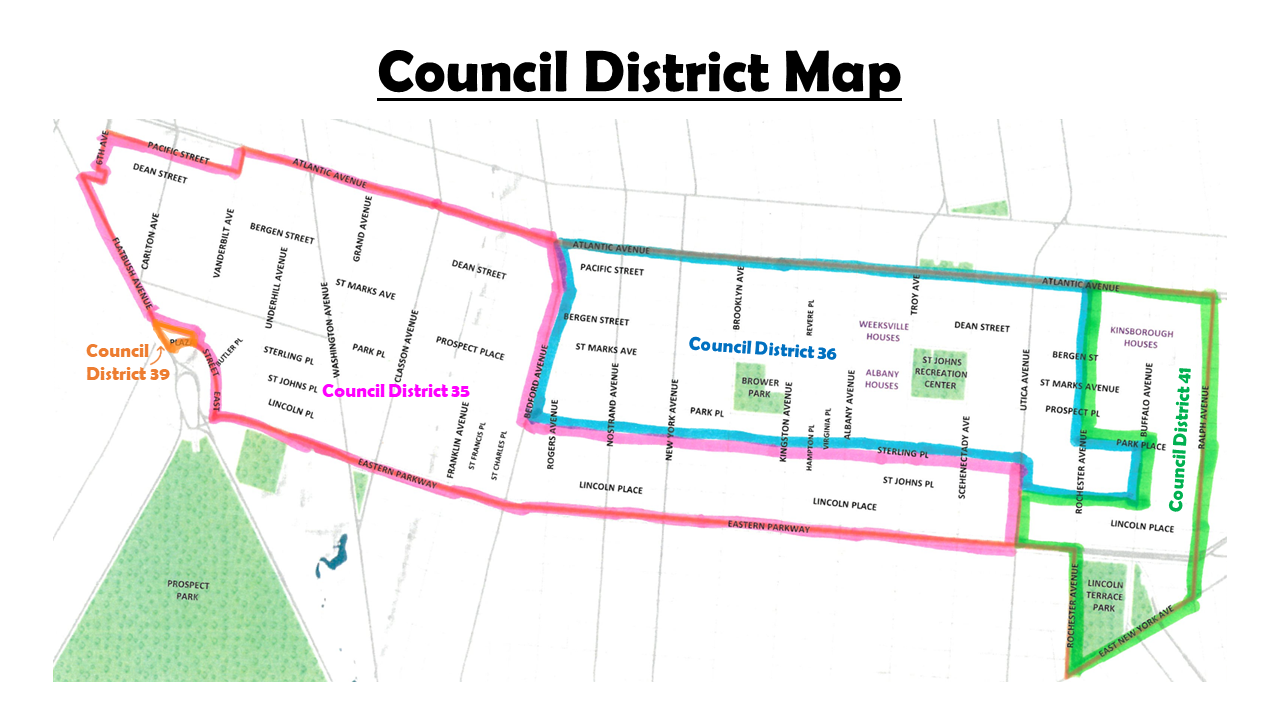
Council District
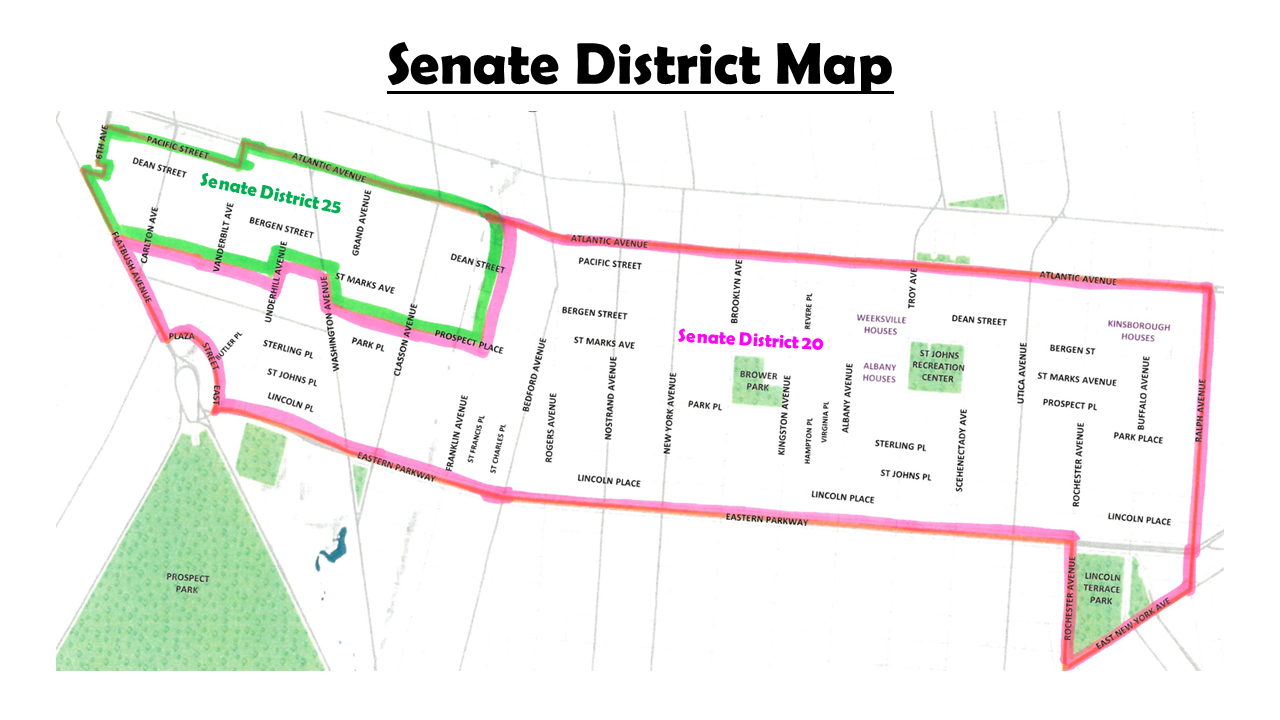
Senate District
Land Use 2012
| Type | Lots | Sq. Ft. (000). | % |
| 1-2 Family Residential | 2,734 | 5,958.30 | 19.3 |
| Multi-Family Residential | 3,242 | 13,095.60 | 42.4 |
| Mixed Resid/Comm. | 1,001 | 2,566.40 | 8.3 |
| Commercial/Office | 143 | 763.1 | 2.5 |
| Industrial | 131 | 1,212.00 | 3.9 |
| Transportation/Utility | 97 | 743.6 | 2.4 |
| Institutions | 223 | 3,184.10 | 10.3 |
| Open Space/Recreation | 19 | 1,667.00 | 5.4 |
| Parking Facilities | 147 | 665.2 | 2.2 |
| Vacant Land | 344 | 898 | 2.9 |
| Miscellanious | 58 | 103.4 | 0.3 |
| TOTAL | 8,139 | 30,856.60 | 100 |
Total Land Area: Acres: 1,047.6 | Square Miles: 1.6
Statistics
| Total Population | 1990 | 96400 |
| 2000 | 96,076 (-0.3) | |
| 2010 | 96,317 (+0.3) | |
| Vital Statistics | ||
| Births: | 2005 | 1,471 |
| 2010 | 1,408 | |
| Rate per 1000 | 2005 | 15.3% |
| 2010 | 14.6% | |
| Deaths: | 2005 | 669 |
| 2010 | 577 | |
| Rate per 1000 | 2005 | 7.0% |
| 2010 | 6.0% | |
| Infant Mortality: | 2005 | 14 |
| 2010 | – | |
| Rate per 1000 | 2005 | 9.5% |
| 2010 | 5.8% | |
| Income Support | ||
| Public Assistance (TANF) | 2005 | 9,902 |
| 2012 | 7,099 | |
| Supplemental Security Income: | 2005 | 5,345 |
| 2012 | 5,849 | |
| Medicaid Only | 2005 | 37,809 |
| 2012 | 24,031 | |
| Total Persons Assisted | 2005 | 37,809 |
| 2012 | 36,979 | |
| Percent of Population | 2005 | 39.4 |
| 2012 | 38.4 |